 Order Book
The liquidity behind every candle
A live depth-of-market heatmap that runs beside your chart. Watch where size is resting, where it pulls just before price arrives and where the market gets absorbed.
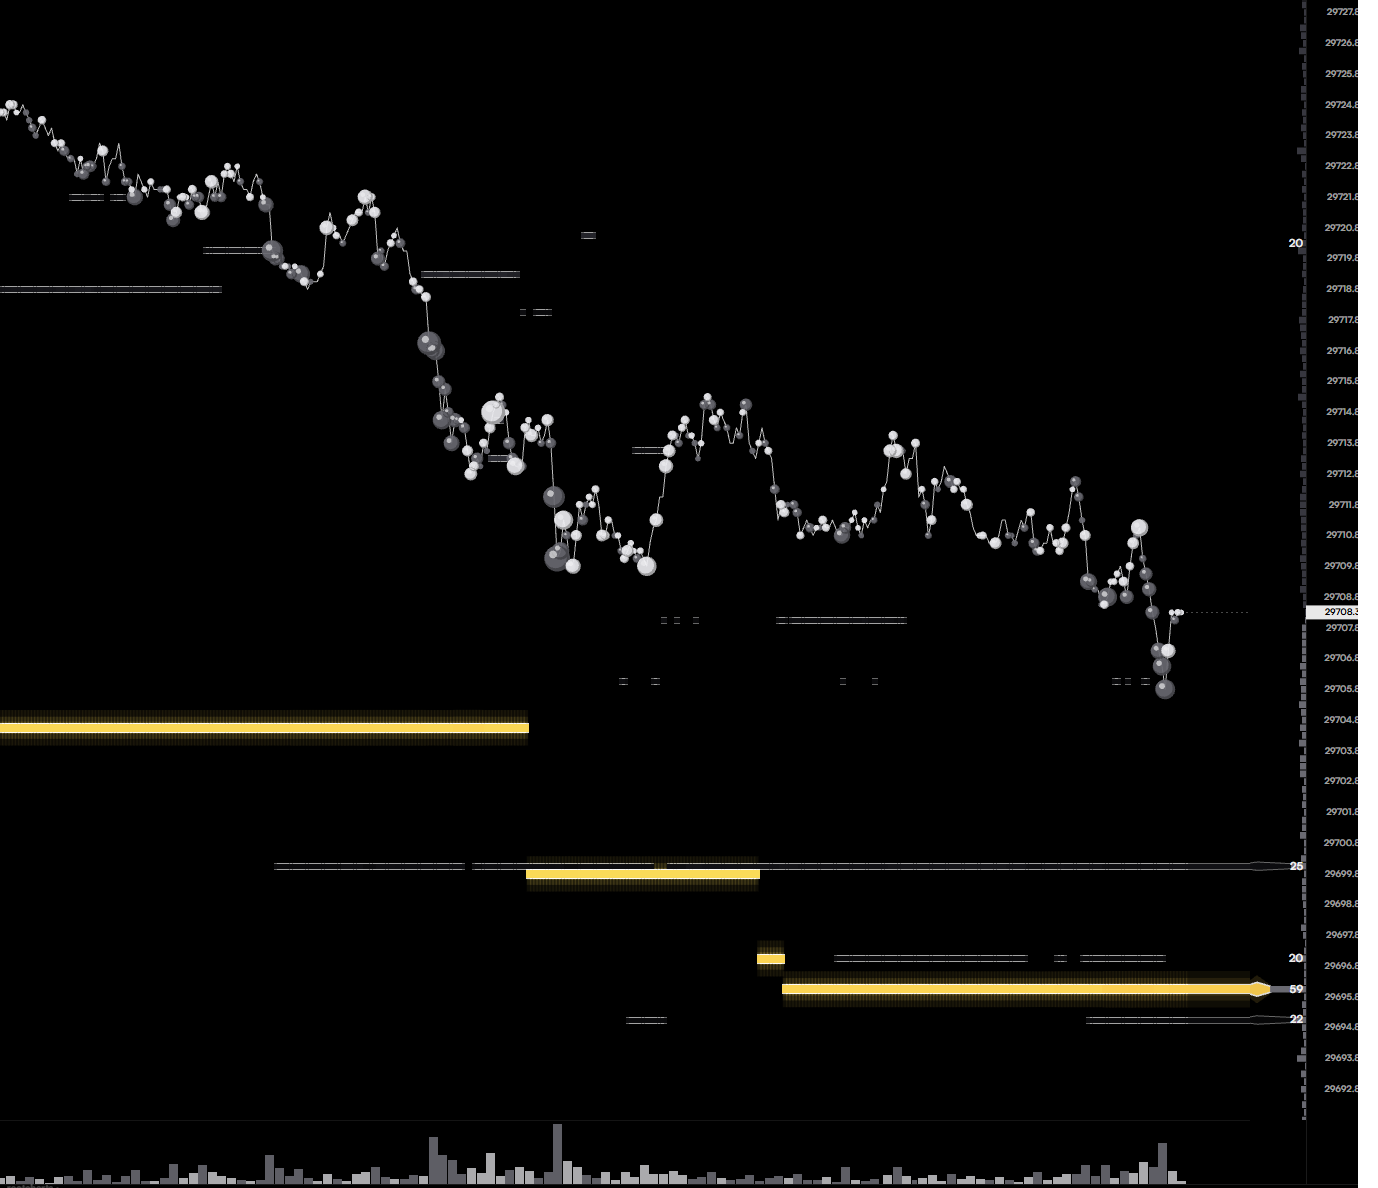
- Full order-book history painted as a heatmap, not just the top of book
- Brighter means bigger — spot walls and icebergs at a glance
- Absolute size thresholds so a level that matters always gets colour
- Same symbol and timeframe as your chart, side by side in one window